AI Agent Evaluation Metrics: The Production Scorecard That Tells You What to Fix
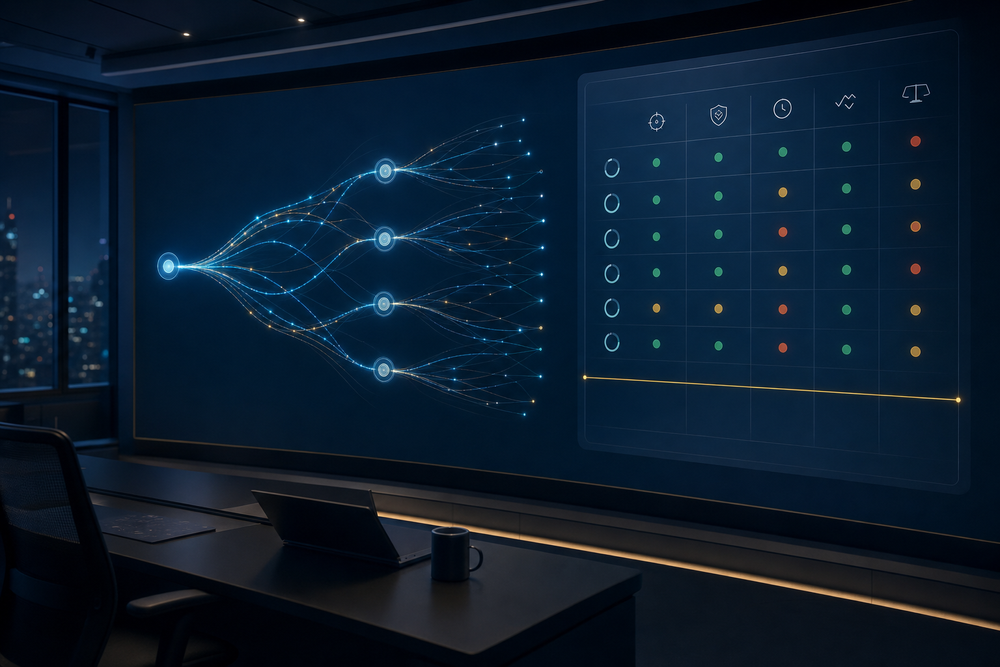
An agent that can complete a demo is not necessarily an agent you can operate. In production, the question is not simply, “Did the model generate a good answer?” It is: did the agent complete the intended outcome safely, within the agreed time and cost, with evidence a team can review?
That requires a scorecard—not a pile of dashboards. A useful scorecard defines each metric, its denominator, its target, its owner, and the action a team takes when the number moves.
This guide is deliberately about production measurement. If you need to design test cases, regression datasets, adversarial scenarios, or release gates, start with our AI agent testing framework. If you are choosing the trace and telemetry layer, use our AI agent observability tools comparison. Here, we focus on the operating questions that begin after real work starts flowing through an agent.
When the evidence is ready for a business approval decision, use the AI agent acceptance criteria template to record the approved boundary, human control, rollback threshold, and re-approval triggers.
The short version: use a small set of outcome, quality, reliability, efficiency, and safety metrics. Break them down by workflow and cohort. Set an SLO-like target for the metrics that matter to users. Review sampled failures on a fixed cadence. Then change one thing at a time and compare against the baseline.
Evaluation metrics vs. observability vs. testing
These terms are connected but not interchangeable:
- Observability records what happened: the input, model calls, tools, handoffs, outputs, latency, and errors. Microsoft describes observability as the source of metrics and evaluation as the process of analyzing that data to decide how an agent is performing. Source, accessed 2026-08-28
- Testing asks whether a change satisfies predefined cases before or during release. It owns case design and regression coverage.
- Evaluation metrics describe production performance over a defined population and time window. They tell an operator whether a workflow is delivering the intended service, where it is degrading, and what deserves attention next.
A trace is the bridge. OpenAI defines a trace as the end-to-end record of model calls, tool calls, guardrails, and handoffs for one run. Source, accessed 2026-08-28 LangSmith likewise treats traces as the production record used to debug failures, monitor quality, and form evaluation datasets. Source, accessed 2026-08-28
Start with one measurable unit of work
Do not score “the agent” as a single black box. Score a specific workflow and one completed-run population.
For example:
| Vague goal | Measurable unit of work | Evidence of completion |
|---|---|---|
| “Answer support questions well” | One resolved support conversation | Correct answer, required system action completed, no unsafe claim, customer did not reopen inside the agreed window |
| “Reconcile invoices” | One invoice reconciliation run | Correct match or correctly escalated exception, auditable source links, ledger update committed |
| “Research accounts” | One account research packet | Required fields sourced, confidence rules met, unsupported facts labeled, packet delivered to the correct queue |
| “Execute a handoff” | One multi-step case handoff | Correct next owner, complete state, policy checks passed, no duplicated action |
This is more than semantics. The denominator becomes defensible: eligible completed runs in a named workflow, during a named window. Exclude only reasons agreed in advance—such as user-cancelled jobs or upstream outages—and report exclusions separately.
Google’s SRE guidance calls an SLI a carefully defined quantitative measure and an SLO a target value or range for that measure. It also recommends a handful of representative indicators rather than every possible metric. Source, accessed 2026-08-28
The six metric families every production scorecard needs
1. Outcome success rate
Definition: the share of eligible runs that reach the user’s intended, verifiable outcome.
Outcome success rate = successful eligible runs / all eligible runs
“Successful” must be workflow-specific. A draft created is not a successful invoice reconciliation. A model response is not a successful support resolution. Treat a run as successful only when the business outcome and required controls are both met.
Use it for: the headline metric. It is the best single answer to “is this workflow helping?”
Do not use it alone: a high success rate can hide slow, expensive, unsafe, or low-quality behavior.
2. Quality and correctness
Definition: a reviewable score for whether the outcome was correct, complete, grounded, and fit for the intended use.
Quality often needs more than one lens:
- Deterministic checks: required fields, schema validity, exact matches, policy rules, citation presence, duplicate prevention.
- Human review: a stratified sample of normal runs, edge cases, and failures.
- Model-assisted grading: a repeatable rubric for scalable triage, calibrated against human judgment.
OpenAI recommends combining production, expert-created, and historical data when building evaluations, and continuing to grow the set as new nondeterministic behavior appears. Source, accessed 2026-08-28
Scorecard fields:
| Metric | Definition | Example starting target | Owner when breached |
|---|---|---|---|
| Correctness rate | Reviewed runs that produce a correct outcome | Baseline first; then improve against it | Workflow owner |
| Completeness rate | Runs containing every required output or action | 99% for deterministic required fields | Product/operations owner |
| Grounding rate | Claims in reviewed outputs supported by approved sources | Risk-based; require 100% for regulated claims | Domain owner |
| Reopen/rework rate | Completed runs later corrected or reopened | Baseline first; lower is better | Workflow owner |
The targets are examples, not universal standards. A low-risk content workflow and a payment workflow should not share the same tolerance.
3. Tool and handoff reliability
Agents often fail at the seams: a correct plan can still call the wrong tool, write an incomplete record, loop on retries, or hand work to the wrong owner.
Measure these directly:
Tool success rate = successful tool calls / attempted tool calls
Handoff completeness = handoffs with all required state / total handoffs
Policy-block rate = policy-blocked runs / eligible runs
Split tool reliability by integration and action. A blended number can make one fragile external dependency look harmless. OpenAI’s trace model explicitly includes tool calls, guardrails, and handoffs, which makes these segments appropriate evaluation points. Source, accessed 2026-08-28
What to inspect when it falls: top error category, retry count distribution, tool inputs for the failed cohort, changed credentials or schemas, and whether the agent attempted a prohibited fallback.
4. Latency and throughput
Latency belongs in an agent scorecard because waiting changes user experience and can change completion rates. But averages are a trap. Google’s SRE Book cautions that average latency can hide a slow tail and recommends thinking in distributions. Source, accessed 2026-08-28
Track:
- End-to-end p50/p95 completion time for eligible runs
- Step-level p95 latency for model, tool, approval, and queue stages
- Queue age before the agent begins work
- Throughput only when it is tied to a capacity or backlog decision
A useful target expresses the user promise: “95% of low-risk routing cases finish inside five minutes,” not “make latency lower.” Keep approval wait time separate from active agent time so the team does not optimize the wrong bottleneck.
5. Cost efficiency
Cost without outcome quality rewards cheap failures; quality without cost can reward extravagant workflows. Pair them.
Cost per successful outcome = total attributable workflow cost / successful eligible runs
Also track cost per attempted run, token or model spend by stage, external-tool cost, and retries per successful outcome. Segment by task complexity before calling a change “more efficient.” Otherwise a lighter week can masquerade as optimization.
6. Safety, control, and recovery
Safety is not an annotation after the scorecard. It is a production metric family.
| Metric | What it tells you |
|---|---|
| Unauthorized-action rate | Whether the agent attempted an action outside its grant or approval boundary |
| Guardrail catch rate | How often controls correctly intercept policy-breaking behavior; review both true and false positives |
| Escalation precision | Whether runs sent to humans actually needed human judgment |
| Recovery success rate | Whether a failed run resumes, compensates, or rolls back without creating a second error |
| Duplicate-action rate | Whether retries or concurrent runs created the same external side effect more than once |
| Audit-evidence completeness | Whether the run retains the inputs, decisions, actions, and outputs required for review |
For the remediation controls behind these metrics—idempotency, checkpointing, escalation, rollback, and approvals—use the AI agent reliability checklist.
A scorecard template you can repeat across workflows
Copy this table into the workflow’s operating record. It forces every number to become an operational decision rather than dashboard décor.
| Metric | Exact definition & denominator | Segment | Target / threshold | Source | Owner | When breached |
|---|---|---|---|---|---|---|
| Outcome success rate | Verified successful eligible runs / eligible runs | Workflow + task type | SLO-like target after baseline | Run records + review | Workflow owner | Pause change rollout; inspect failure cohort |
| Correctness rate | Correct reviewed runs / reviewed runs | Risk tier | Risk-based target | Human/model rubric | Domain owner | Expand sample; identify error pattern |
| Tool success rate | Successful calls / attempted calls | Tool + operation | Baseline and alert threshold | Traces | Integration owner | Check schema, auth, retry behavior |
| p95 completion time | 95th percentile end-to-end time | Priority tier | User promise | Traces + queue data | Operations owner | Identify slowest stage; separate approval wait |
| Cost per success | Attributable cost / successful runs | Complexity tier | Budget guardrail | Billing + traces | Workflow owner | Compare model/tool mix and retries |
| Unauthorized-action rate | Unauthorized attempts / eligible runs | Permission tier | Zero tolerance | Guardrail logs | Security owner | Stop affected path; review grants |
| Recovery success rate | Correctly recovered failures / recoverable failures | Failure type | Baseline and improve | Incident records | Reliability owner | Fix checkpoint/compensation path |
Choose thresholds without pretending you know the answer on day one
The cleanest pattern is:
- Instrument first. Capture the outcome, workflow version, task type, tool calls, handoffs, approvals, cost, and terminal state.
- Baseline a stable window. Use enough volume to understand normal variance; retain a separate view for rare, high-risk cases.
- Set a target tied to user impact. An SLO should describe a value that matters to the user or business, not the metric that happens to be easiest to collect.
- Define the action before the alert. A threshold without an owner and playbook is just a notification.
- Revisit after material changes. New model, prompt, tool schema, routing logic, policy, or task mix means the old baseline may no longer be comparable.
Google notes that client-side measurement can better represent user experience when server-side measurements miss browser or interface delays. Source, accessed 2026-08-28 Apply the same principle to agents: measure the completed user outcome, not only a fast model response.
The weekly agent-evaluation review cadence
A scorecard works when it creates a short, disciplined operating loop.
Daily: automated watch
- Flag hard failures, unauthorized attempts, duplicate external actions, and significant tool outages.
- Compare p95 completion time and cost per success with the most recent stable baseline.
- Route urgent safety or financial breaches to a named human immediately.
Weekly: operating review
Use one owner and a 30-minute agenda:
- Read the scorecard: outcome, quality sample, tool reliability, p95 time, cost per success, safety/recovery.
- Review the worst cohort: not just the global average—break down by task type, integration, model version, and risk tier.
- Read a sample of traces: include a success, a failure, and a borderline case. Trace grading can help benchmark changes, locate regressions, and validate improvements. Source, accessed 2026-08-28
- Choose one remediation: fix the error class with the highest user impact, not the easiest chart to improve.
- Record the comparison: change, hypothesis, expected metric movement, control group or pre-change baseline, and next review date.
Monthly: scorecard maintenance
- Retire vanity metrics that did not drive a decision.
- Refresh rubric examples with newly observed production edge cases.
- Reconfirm owners, escalation paths, and approval boundaries.
- Audit exclusions and denominators so a “better” rate is not simply a narrower population.
Common scorecard mistakes
Counting responses instead of outcomes
An agent can respond beautifully and still fail to update the system of record, route the task, or preserve audit evidence. Count the user-visible or operationally verifiable completion.
Using a single quality score
A blended score hides trade-offs. Keep correctness, completeness, safety, latency, and cost visible enough to argue about them.
Alerting on averages
Averages conceal the long tail—the precise cases that customers and operators remember. Use percentiles and cohort splits.
Treating guardrail blocks as failures by default
A correct block may be a success for safety. Measure policy blocks separately, review their precision, and do not reward a system for bypassing controls.
Copying someone else’s thresholds
A published target can be a useful starting prompt, not a substitute for your workflow’s risk, cost, user promise, and baseline.
Rebuilding the test plan inside the dashboard
Tests tell you whether expected behavior holds under designed cases. Scorecards tell you whether production operations are healthy. Keep both, and link them.
A practical 30-day implementation plan
Week 1 — define the unit of work
Choose one workflow. Write the success condition, eligible-run denominator, required evidence, and the actions that require approval. Add trace fields for workflow version, task type, tool calls, handoffs, and terminal status.
Week 2 — establish the first scorecard
Start with outcome success, one quality measure, tool success, p95 completion time, cost per success, and one control metric. Record data-source gaps honestly rather than inventing proxies.
Week 3 — sample and calibrate
Review a stratified sample with the people who understand the work. Compare human judgement with any automated graders. Add the real edge cases to the testing program.
Week 4 — set action thresholds
Set initial targets from the observed baseline and user impact. Assign an owner, escalation path, and remediation action for each meaningful breach. Keep the threshold provisional until enough runs support it.
The scorecard is how an AI worker earns operational trust
Production evaluation is not a hunt for one magic “agent score.” It is an agreement about what success means, what evidence proves it, which trade-offs are acceptable, and who acts when the workflow drifts.
If you are moving from experiments to production AI workers, talk with the Midpoint team. We can help map a workflow to measurable outcomes, approval boundaries, reliability controls, and an operating cadence your team can actually run.
Sources
- Google SRE Book, Service Level Objectives (accessed 2026-08-28)
- OpenAI, Evaluate agent workflows (accessed 2026-08-28)
- OpenAI, Trace grading (accessed 2026-08-28)
- OpenAI, Evaluation best practices (accessed 2026-08-28)
- LangSmith, Observability (accessed 2026-08-28)
- Microsoft AI Agents for Beginners, AI Agents in Production: Observability & Evaluation (accessed 2026-08-28)
More articles

AI Agent Incident Communication Plan: Templates, Cadence, and Evidence
A practical AI agent incident communication plan with severity criteria, stakeholder templates, status cadence, evidence, and follow-up.

AI Agent Data Privacy Checklist: Controls That Hold Up in Production
A practical enterprise checklist for classifying agent data, minimizing access, controlling retention and transfers, redacting evidence, reviewing vendors, and proving incident readiness.

AI Agent Observability Tools Compared: A Practical Buyer Guide
Compare eight AI agent observability approaches by traces, tool calls, evaluations, cost, privacy, alerts, deployment, and OpenTelemetry support.