Browser Automation Monitoring Checklist: Signals, Alerts, Evidence, and Ownership
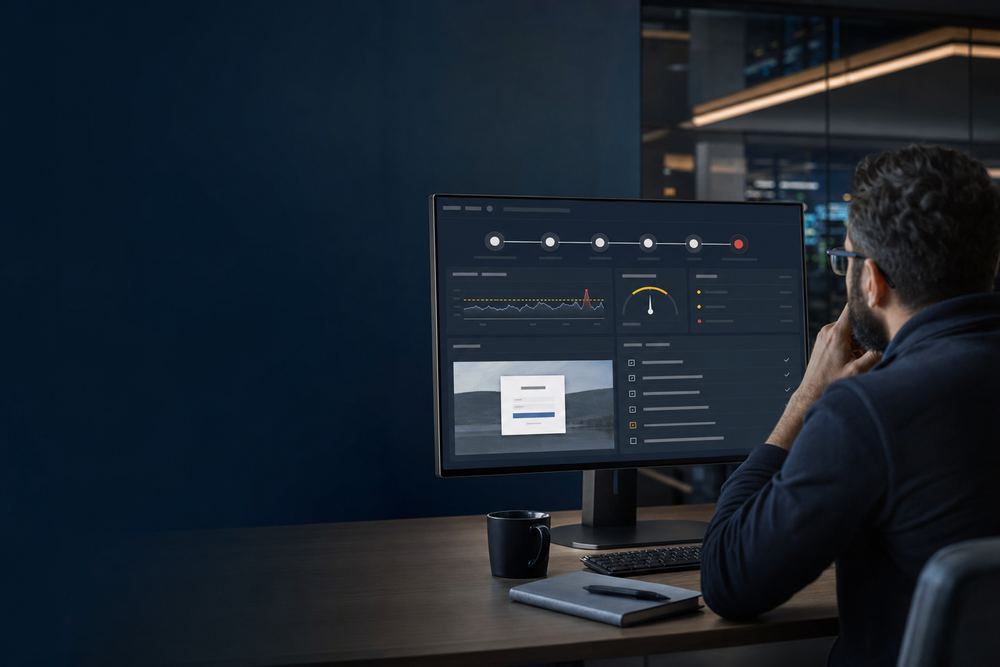
The automation did not “go down.” It quietly stopped completing the login, the approval, or the handoff that keeps a customer moving. A green HTTP check is cold comfort when the person waiting on the other end is blocked.
This checklist helps a team monitor the journeys that matter: choose one safe browser path, define the outcome that proves it worked, capture evidence when it does not, and make sure the alert lands with someone who can act. The goal is not more dashboards. It is finding the broken step before a customer does.
Use this when: a worker or browser automation handles a business-critical path and a UI, permission, session, or third-party change could silently break it.
In Midpoint, turn the monitor into an operating loop: put the critical journey and alert rule on the workflow ticket, let the worker preserve the failed-run evidence, route the owner in the channel, and keep the recovery decision beside the flow. That is a much better first alert than “browser check failed.”
This page is about the monitor and the response owner. For platform selection, see AI agent observability tools; for permissions and hostile-page controls, see the browser automation security checklist; for confirmed incidents, use the AI agent failure recovery playbook.
What browser automation monitoring must prove
Start with a small number of business-critical journeys. “The homepage loads” is useful infrastructure coverage. “An approved operator can sign in, reach the queue, complete a non-destructive action, and receive a confirmation” is an operational signal.
Every monitored journey needs five explicit elements:
- User outcome: the observable end state, not just an HTTP success. Examples: dashboard heading is visible, a draft is created, or an approval confirmation has a reference.
- Safe test identity and data: dedicated accounts, non-production payment paths, disposable records, and cleanup. A monitor must not create customer-facing noise or irreversible side effects.
- Run identity: check name, version, location, browser, environment, attempt, and timestamp. This separates a change in the check from a change in the product.
- Signal contract: success condition, timeout, expected latency band, failure taxonomy, and SLO/alert policy.
- Response owner: the person or team that receives the alert, the first diagnostic action, escalation path, and stop/disable authority.
Checkly’s synthetic-monitoring guidance makes the important distinction: an uptime response says a server answered; a browser journey can verify that a login or checkout actually completed. Its product documentation also draws the boundary clearly: synthetic checks do not replace real-user monitoring, host metrics, log search, or APM. Checkly synthetic monitoring
Choose the smallest useful journey
A long “everything works” script is a brittle alarm. Split a journey into meaningful checkpoints so the alert says where the customer outcome broke:
| Checkpoint | Good assertion | Bad assertion | Why it matters |
|---|---|---|---|
| Authentication | intended role reaches the signed-in landing state | login form returned 200 | Separates identity/session failures from page availability |
| Navigation | required work queue or record is visible | a click happened | Detects routing, permission, and rendering failures |
| Core task | safe action returns a durable confirmation | button was enabled | Tests the business outcome, not UI cosmetics |
| Result visibility | expected status or receipt appears | no exception thrown | Catches async and stale-state failures |
| Cleanup | disposable record is removed or marked | script ended | Prevents monitor-created data drift |
Use stable, purpose-built locators and assertions that match a real outcome. A check should not depend on incidental copy, animation timing, or a selector that a designer can rename without changing the feature. Keep each monitored flow independently runnable so an unrelated failure does not hide the failing stage.
The browser automation monitoring checklist
Use this list before a check earns an on-call alert.
1. Define the monitor contract
- [ ] Name the journey after the user outcome:
operator-approval-completes, nottest-17. - [ ] Record environment, browser/device profile, run location, frequency, timeout, and test-data owner.
- [ ] Define success at the final meaningful user-visible state.
- [ ] Decide which failures are product failures, expected maintenance, test-data faults, third-party dependency faults, or monitor defects.
- [ ] Assign one accountable response owner and a backup. “The platform team” is not an escalation path.
- [ ] Version the check with application code and review monitor changes like production changes.
A browser check running against production is production code. It needs the same release discipline as the workflow it observes. That includes a documented owner for test credentials and a quick way to pause a noisy check during an approved maintenance window.
2. Instrument every run for correlation
A failed screenshot alone tells a person where the browser stopped, not what happened after the click. Emit a compact run envelope from the monitor and correlate it with application telemetry.
At minimum, record:
- monitor/check ID, code version, environment, start and end time;
- browser, viewport, region or execution location;
- step name and step duration;
- final state, error class, and sanitized response status; and
- a trace or request correlation reference when the product supports it.
OpenTelemetry’s HTTP conventions define standard HTTP server/client duration metrics and recommend a synthetic-traffic attribute (user_agent.synthetic.type) that can identify traffic generated by tests or bots. Use that distinction so your monitors do not silently pollute customer conversion, performance, or availability analysis. OpenTelemetry HTTP metrics
Do not put secrets, raw customer content, authentication cookies, or full query strings into routine monitor labels. Keep dimensions low-cardinality and meaningful: route template, step, region, browser profile, error class, and monitor version are useful. A unique user ID for every run is usually not.
3. Capture evidence on failure without creating an evidence swamp
Evidence must answer three questions: what did the browser see, what did it attempt, and what did the dependent systems report? Capture it at the right granularity:
| Evidence | Capture rule | First use | Access/retention rule |
|---|---|---|---|
| Screenshot | failure and final state | visual defect, error page, wrong state | redact or restrict if customer data can appear |
| Trace | failure; optionally first retry | timing, DOM actions, network sequence | retain only for diagnostic window |
| Browser console | failure and selected warnings | client exceptions and blocked resources | mask sensitive payloads |
| Network summary | failure | endpoint/status/latency correlation | never store credentials or raw bodies by default |
| Application trace/log reference | every run when available | backend correlation | store reference, not duplicate sensitive content |
| Runbook link | every alert | response consistency | version alongside monitor |
Playwright’s Trace Viewer documents that a trace can expose action logs, DOM snapshots, console logs, network activity, screenshots, metadata, and attachments. Its CI guidance supports recording a trace on the first retry or retaining traces only on failure. These are useful evidence policies because recording every successful run can be expensive and unnecessary. Playwright Trace Viewer
Evidence is not a license to retain everything. Set access controls and a retention period before the first alert. If a monitored workflow can render customer data, use dedicated data and restrict artifacts to the responders who need them.
4. Alert on meaningful, sustained customer impact
One failed run can be a bad network hop, a transient dependency failure, or a monitor defect. One hundred quiet failures can mean the check has lost its owner. Good UI automation alerts balance precision, recall, detection time, and reset behavior.
Start with a simple alert matrix and tune it using observed traffic, impact, and recovery behavior:
| Signal | Suggested initial rule | Page? | Response |
|---|---|---|---|
| Critical journey unavailable from two locations | two consecutive failed cycles or a short/long-window failure-rate breach | Yes | declare/triage incident; preserve evidence |
| Critical journey exceeds user-facing latency target | sustained breach across a defined window | Usually, if impact is material | correlate with backend latency and deploys |
| One location/browser profile fails | repeat in a second location/profile before escalation | Usually no | create investigation signal; inspect regional/CDN/browser factors |
| One failed run, retry passes | count as a flaky event | No | retain first-retry evidence; fix only if trend grows |
| Test-data/credential expiry | known error signature | No, route to check owner | repair identity/data; do not page product on-call |
| Check has not run or stopped reporting | missed heartbeat threshold | Yes for critical journey | investigate scheduler/runner/credential health |
Do not copy those numbers as universal thresholds. Derive them from the journey’s risk, run frequency, known noise, and recovery objective. Google’s SRE guidance frames alert quality around precision, recall, detection time, and reset time, and recommends using error-budget burn rate to connect the rate of bad events to a meaningful response priority. Google SRE: Alerting on SLOs
For a low-volume journey, use absolute consecutive-failure logic alongside rates: percentages are unstable when there are only a handful of samples. For a high-frequency journey, calculate a short window for fast detection and a longer window for confidence, then route them differently. Alert on the symptom the customer feels, such as “approval cannot complete,” and include the diagnostic signals underneath it.
5. Put response ownership in the alert itself
An alert without a first action is an interruption, not an operating control. Each alert should include:
- impact statement and journey name;
- failing step, locations, browser profile, and observed duration/error class;
- links to the evidence bundle and correlated telemetry;
- current deployment/configuration reference;
- the named primary and backup owner;
- first three diagnostic actions; and
- escalation and customer-communication criteria.
Google’s SRE on-call guidance describes playbooks as high-level instructions for responding to automated alerts, including alert severity/impact, debugging suggestions, and mitigation actions. Write the playbook while the monitor is healthy; it is much harder to invent under pressure. Google SRE: Being On-Call
Keep recovery mechanics separate. This monitor tells the team that a customer outcome is failing and provides the evidence. The failure recovery playbook handles stop/continue decisions, retries, reconciliation, compensation, rollback, and postmortem work. That boundary prevents monitoring from becoming a vague “self-healing” claim.
Measure the monitor itself
A monitor that never runs, silently loses its test identity, or only reports generic timeouts is another production dependency. Track execution freshness, success rate, duration, retry rate, artifact availability, and alert delivery separately from the user journey. That makes a monitor fault visible without treating it as a customer outage. Assign the same clear ownership to monitor health as to the workflow it checks.
A practical alert-and-evidence template
Use this record for every production browser monitor:
Monitor name and business outcome:
Owner / backup / escalation channel:
Environment / browser profile / run locations / frequency:
Dedicated identity and test-data cleanup owner:

Success contract
- Final user-visible assertion:
- Timeout and latency objective:
- Known maintenance or expected-error signatures:

Signal contract
- Success, product failure, dependency failure, monitor defect, and test-data fault definitions:
- Consecutive-failure and short/long-window thresholds:
- Missing-run threshold:
- Page versus ticket/investigation routing:

Evidence contract
- Failure screenshot:
- Trace/retry policy:
- Console and network redaction policy:
- Correlation fields and telemetry links:
- Artifact access and expiration:

Response contract
- First three actions:
- Stop/disable authority:
- Escalation trigger:
- Recovery-runbook link:
- Last drill or alert-tuning review:
Review the monitor after every meaningful change
Browser workflows drift. Login policy changes, a feature flag moves, a third-party consent page appears, a connector gains a new permission, or a UI element is redesigned. A monitor that keeps passing may no longer cover the risky path; a monitor that keeps failing may be testing obsolete behavior.
Review each critical monitor after a material journey change and at a recurring operating cadence. Confirm the check still uses a safe identity, the final assertion still represents value, the evidence does not over-collect, and the alert reaches a person who can act. Tie the review to broader quality signals in the AI agent evaluation metrics guide, but do not mistake offline model evaluation for a live browser journey.
The goal is not more UI automation alerts. It is fewer blind spots: a reliable signal when a real workflow stops working, enough evidence to diagnose it, and a clear owner who knows what happens next.
If you are building browser-driven workflows across real systems, Midpoint Enterprise can help you establish monitoring ownership, approvals, and production evidence without turning every automation into a fragile black box.
Sources
More articles
AI Agent Incident Communication Plan: Templates, Cadence, and Evidence
A practical AI agent incident communication plan with severity criteria, stakeholder templates, status cadence, evidence, and follow-up.

AI Agent Data Privacy Checklist: Controls That Hold Up in Production
A practical enterprise checklist for classifying agent data, minimizing access, controlling retention and transfers, redacting evidence, reviewing vendors, and proving incident readiness.

AI Agent Observability Tools Compared: A Practical Buyer Guide
Compare eight AI agent observability approaches by traces, tool calls, evaluations, cost, privacy, alerts, deployment, and OpenTelemetry support.